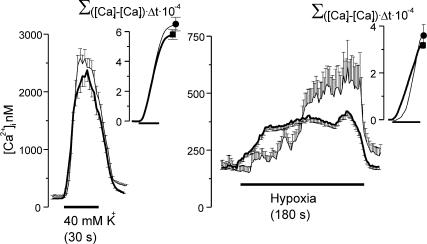
Figure 10. Integrated intracellular calcium responses to hypoxia and high external K+ in chemoreceptor cells isolated form control and hyperoxic animals.
Left and right: the mean time course of the intracellular Ca2+ response elicited by high external K+ (40 mm, 30 s) and hypoxia (PO2≈10 mmHg, 180 s), respectively. Chemoreceptor cells from CB of control animals (thick traces) and hyperoxic animals (thin traces) are shown. The inset shows the accumulative Ca2+ response: Σ([Ca]t–[ca]r) × Δt × 10-4 where t is time and r is the resting Ca2+ level. Data are mean ±s.e.m. of 158 control and 43 hyperoxic cells.

