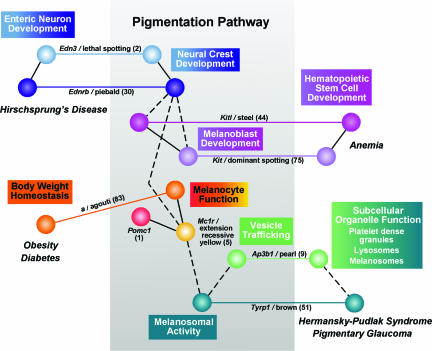
Figure 1. Connecting genes with pathways, biology and disease.
A simple network diagram built around a small subset of coat colour loci illustrates the value of a collection of mutations to model relationships that underlie genetic complexity. This framework demonstrates the progression of the pigmentation pathway (from Barsh, 1996), the comparable activities for genes in multiple biological processes, and similarities in the genetic and cellular basis of disease. Direct relationships are indicated by a continuous line, while indirect interactions are indicated by a dashed line. The number of phenotypic alleles for each locus is indicated in parentheses next to each gene name (from http://www.informatics.jax.org/). Multiple alleles at each locus were invaluable for appreciating this set of associations.

