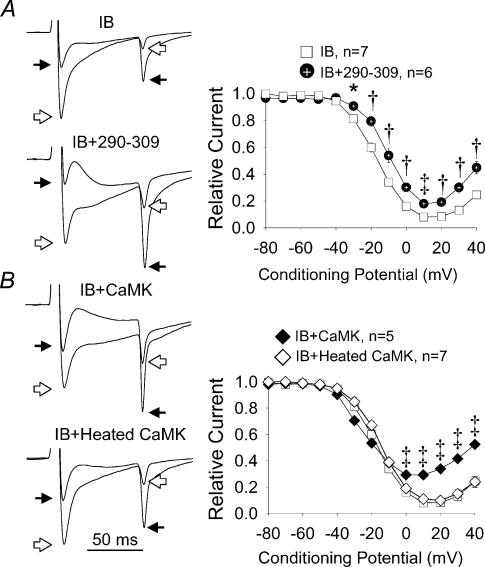
Figure 3. The effects of Ca2+–CaM and CaMK on ICa−L.
A, the left panels show superimposed current tracings (as in Fig. 2A) in response to conditioning prepulses to +20 mV (open arrows) and +40 mV (filled arrows) in cells dialysed with IB (IB) or a combination of IB and the Ca2+–CaM inhibitory peptide 290–309 (IB + 290–309). The right panel shows summary findings for peak ICa−L after 80 ms conditioning prepulses from –80 to +40 mV (abscissa) in cells treated as described in the left panels. B, the left panels show superimposed current tracings labelled as in A (above), but these cells were dialysed with IB and a Ca2+-independent form of CaMK (IB + CaMK) or IB and heat-inactivated CaMK (IB + heated CaMK). The right panel shows summary findings for peak ICa−L (as in A), but from cells treated as in the left panels. Dialysis with a Ca2+–CaM-independent form of CaMK that is resistant to IB increases relative ICa−L (80 ms prepulses) compared to IB alone after positive conditioning pulses. CaMK activity is ablated by heat inactivation and peak ICa−L is normalized to the maximum value. *P < 0.05, †P < 0.01, ‡P < 0.001 for A and B.

