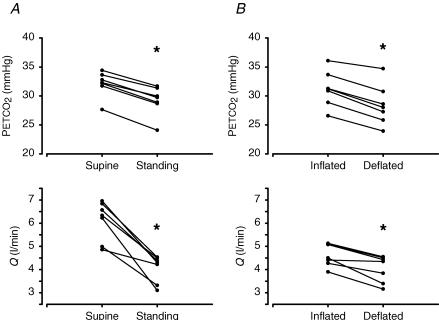
Figure 4. PETCO2 and Q during controlled breathing in 7 healthy subjects.
Results of supine and standing (A) and inflated and deflated leg cuffs (B) protocols. Symbols represent average end-tidal PCO2 (top) and cardiac output (Q, bottom) during 5 min. The lines link the results of a particular subject. Asterisk indicates P < 0.01.

