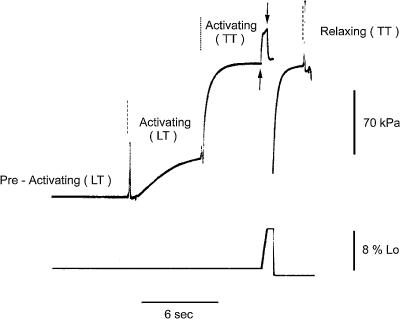
Figure 1. Slow-time-base record from a fast fibre to show the experimental protocol.
Upper trace, force; lower trace, motor position. The dashed lines mark the time when the solution was changed; the dotted line marks the time of transition from low temperature (LT) to test temperature (TT). Arrows indicate the time during which a ramp lengthening (8% of fibre length) at a velocity of 0.09 μm s−1 hs−1 was imposed on the fibre before returning to relaxing solution. A large release (10% of fibre length) is imposed on the fibre to measure the force baseline (not resolved in the force record since the trace is from the chart recorder). Fibre length, 3.03 mm; average sarcomere length, 2.53 μm; CSA, 8900 μm2. Low temperature (LT), 1.0°C; test temperature (TT), 11.5°C. Fibre characterization indicates that the MHC isoform is 2A/2X type.

