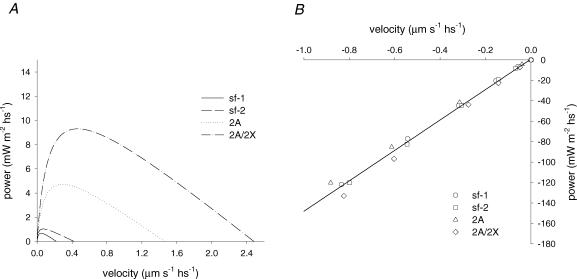
Figure 7. Relations between power and velocity during steady shortening (A) and lengthening (B).
Lines in A were obtained from Hill's equation fitted to the relative force–shortening velocity curves of Fig. 6. The points in B represent the mean values obtained from the points for lengthening in Fig. 6, and the line represents the linear regression (slope, 148.9 ± 2.9 kPa; ordinate intercept, 0.81 ± 1.31 mW m−2 hs−1) fitted to the pooled data.

