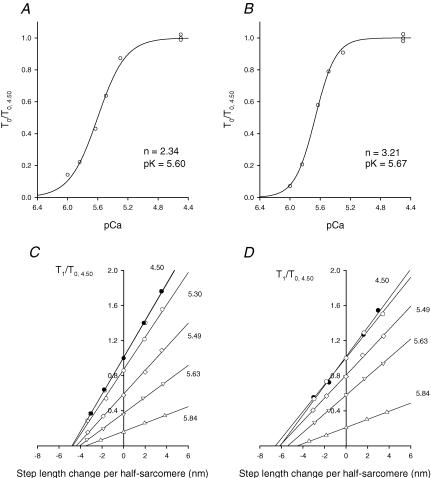
Figure 9. Isometric force–pCa relation (A and B) and T1 relations at different pCa (C and D) in a slow fibre (A and C) and a fast fibre (B and D).
The continuous lines in A and B are calculated from Hill's equation: T0/T0,4.50= 1/[1 + 10n(pK–pCa)], where n, the Hill coefficient, expresses the slope and pK is pCa at which T0= 0.5T0,4.50. The best-fitting parameters, obtained with the nonlinear least-squares method (SigmaPlot, Jandel Scientific), are listed in the figure close to the graphs. T1 curves in C and D are obtained by plotting the extreme tension attained at the end of the length step (T1, relative to T0 at pCa = 4.50, T0,S) against the step amplitude. Different symbols refer to different pCa as indicated by the figure close to the corresponding relation. Circles refer to full activation before (open circles) and after (filled circles) the series at larger pCa. The lines represent the linear regressions fitted to the experimental points at each pCa. A and C, same fibre as in Fig. 8. B and D, fast (2A/2X) fibre: fibre length, 3.51 mm; segment length, 1.03 mm; average sarcomere length in the segment, 2.45 μm; CSA, 9500 μm2; temperature, 12.1°C; T0,S, 109 kPa. Mean values (± s.e.m.) of the isometric force (T0) and stiffness (e0) at full activation are as follows. Slow fibres (3 fibres): T0= 72 ± 5 kPa; e0= 13.97 ± 2.36 kPa nm−1; fast fibres (2 fibres): T0= 106 ± 4 kPa; e0= 16.15 ± 0.93 kPa nm−1.

