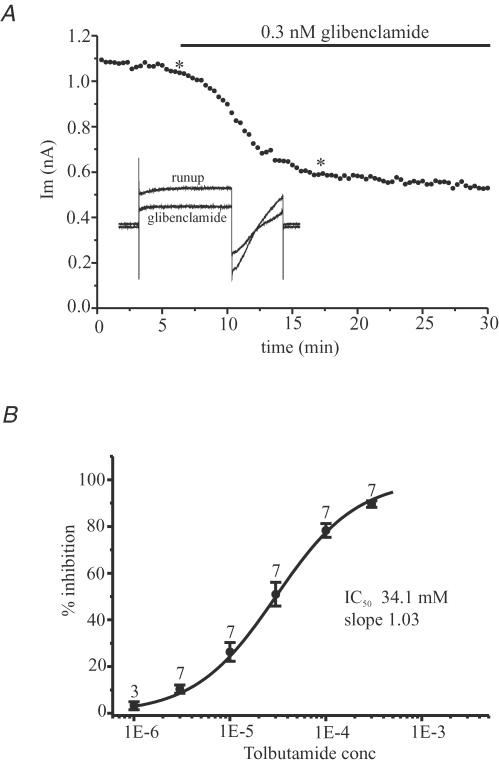
Figure 6.
A, inhibition of run-up current by glibenclamide. The KATP conductance was allowed to maximally activate under whole-cell recording conditions (0 mm[ATP]i). Ordinate is membrane current (Im) evoked by stepping from –80 to –40 mV (see inset) after run-up and in the presence of 0.3 nm glibenclamide. Inset shows membrane current in response to a 2 s step to –40 mV from Vh–80 mV followed by a 0.1 s step to –120 mV and ramp change in Vm to –40 mV (ramp 80 mV s−1) before stepping back to Vh (protocol repeated every 20 s) at the points recording indicated by the asterisk. B, dose–response curve for the KATP current to tolbutamide. The curve was constructed from the mean IC50 and slope values obtained from the individual cells. IC50 and Hill slope values were 34.1 μm and 1.03, respectively. All points are mean ± s.e.m.

