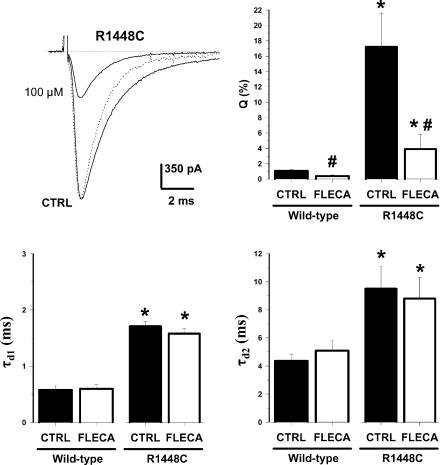
Figure 4. Effects of flecainide on INa decay rate of WT and R1448C hNav1.4 channels.
The INa was evoked by 25 ms-long test pulses to –30 mV applied at 0.1 Hz from the V1/2 of –180 mV before (CTRL) and after application of 100 μm flecainide. To allow direct inspection of drug effect on current decay, INa measured during drug exposure was scaled with respect to peak amplitude of control INa (dashed line). The parameters τd1, τd2 and Q were calculated form the fit of current decay with eqn (5). Each bar represents the mean ± s.e.m. from 8 (WT) and 11 cells (R1448C). Statistical analysis was performed using Student's paired t test, * indicating at least P < 0.01 versus CTRL wild-type and # indicating at least P < 0.02versus relative control.

