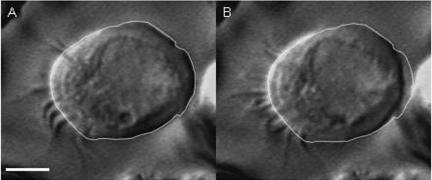
Figure 4. Video DIC images of a single ciliary cell.
A, unstimulated ciliary cell. The outline of the cell was traced. B, ciliary cell 2 min after terbutaline (10 μm) stimulation. The outline of the unstimulated cell (A) was superimposed on the cell in B, and the terbutaline-induced cell shrinkage is clearly shown (V/V0= 0.84). Scale bar, 5 μm.

