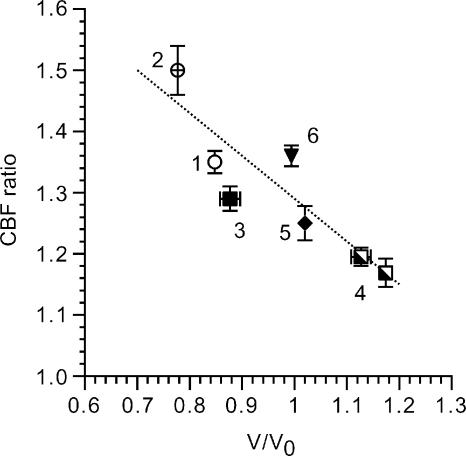
Figure 11. Relationship between CBF ratio and V/V0 during stimulation with 0.5 μm terbutaline.
The numbers by the symbols indicate that the experiments 1 and 2 were NaCl experiments (Fig. 7D) and 3, 4, 5 and 6 were KCl experiments (Fig. 10). 1, terbutaline (0.5 μm) alone. 2, subsequent addition of 1 μm amiloride and 20 μm bumetanide. 3, terbutaline (0.5 μm) alone (KCl experiments in the absence of 1 μm amiloride and 100 μm strophanthidin) (Fig. 10A). 4, KCl experiments in the presence of 1 μm amiloride and 100 μm strophanthidin (Fig. 10B and C). 5, the subsequent removal of 1 μm amiloride (Fig. 10B). 6, the subsequent removal of 100 μm strophanthidin (Fig. 10C). The terbutaline-stimulated CBF ratio increases with decreasing V/V0 (r = 0.91).

