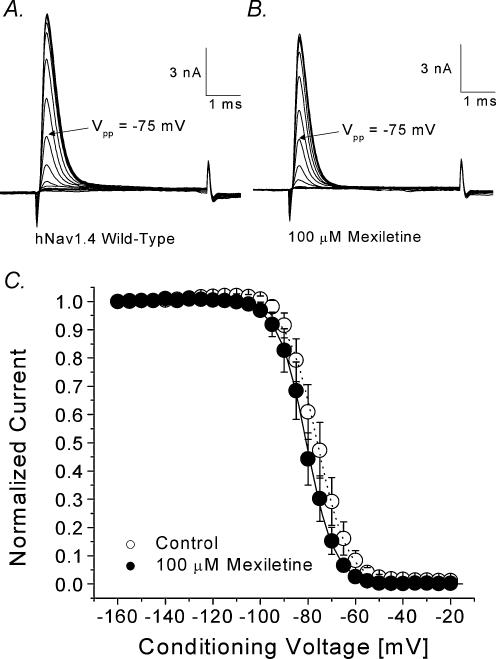
Figure 2. Steady-state inactivation of hNav1.4 with or without 100 μm mexiletine.
Currents were evoked by a 5 ms test pulse to +30 mV in the absence (A) or presence (B) of 100 μm mexiletine. Test pulses were preceded by 100 ms conditioning pulses, increased in 5 mV increments between –160 mV and –120 mV. The interval between pulses was 10 s. C, normalized Na+ current availability (h∞) of hNav1.4 was obtained from data as shown in A and B and plotted against the conditioning voltage. Data were fitted with the Boltzmann function, y= 1/{1 + exp[(V–V0.5)/k]}. The average midpoint (V0.5) and slope factor (k) for the wild-type (○, n= 8) were –75.9 ± 0.2 mV and 6.4 ± 0.2 mV, respectively, and –80.6 ± 0.2 mV and 5.9 ± 0.2 mV for the cells treated with mexiletine (•, n= 5). The difference between two V0.5 values is significant (P < 0.05).

