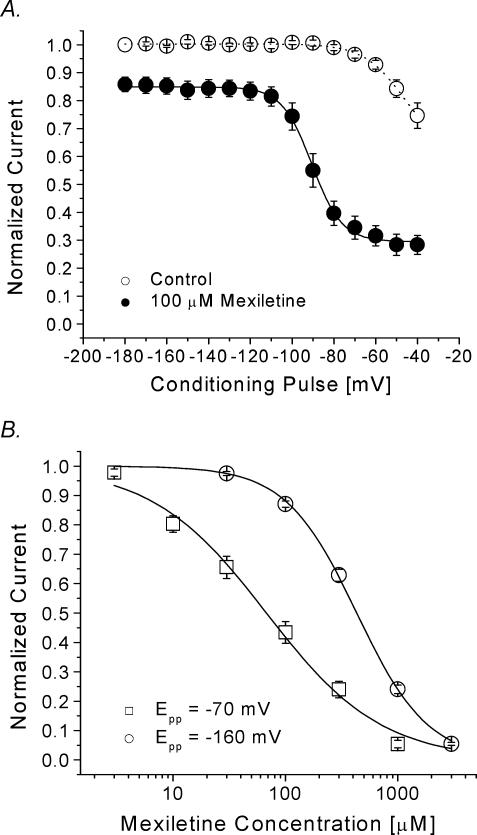
Figure 3. Voltage-dependent block of hNav1.4 by 100 μm mexiletine.
A, a 10 s conditioning prepulse ranging in amplitude from –180 to –40 mV was applied. After a 100 ms interval at –140 mV, Na+ currents were evoked by the delivery of a 5 ms test pulse at +30 mV. Currents obtained in control solution and with 100 μm mexiletine were normalized to the current obtained with the –180 mV control conditioning pulse. Mexiletine data were then renormalized at each conditioning pulse voltage. Normalized control data (○, n= 6) and renormalized mexiletine data (•, n= 5) were plotted against the conditioning prepulse voltages. Mexiletine data were fitted with a Boltzmann function (1/[1 + exp((V0.5–V)/kE)]). The average V0.5 and kE (slope factor) values for the fitted functions were –91.8 ± 0.5 mV and 7.2 ± 0.5 mV, respectively. B, a 10 s conditioning pulse to –70 mV or –160 mV was followed by a 100 ms interval at –140 mV and a 5 ms test pulse to +30 mV to evoke Na+ current. Pulses were delivered at 30 s intervals. The peak amplitudes of Na+ current were measured at various mexiletine concentrations, normalized to the peak amplitude of the control, and plotted against drug concentration. Continuous lines represent fits to the data with the Hill equation. IC50 values ±s.e.m. and Hill coefficients ±s.e.m. (in square brackets) for inactivated-state block at –70 mV (□, n= 5), and for the resting-state block at –160 mV (○, n= 5) are 67.8 ± 7.0 μm[0.85 ± 0.07], and 431.2 ± 9.4 μm[1.3 ± 0.3], respectively.

