
Figure 3. Hormone-induced [3H]taurine efflux from rat pituicytes.

A, taurine efflux induced by 10 nm VP in the absence (continuous line; n = 17) or in the presence (dashed line; n = 5) of 100 nm SR 49059. The dotted line shows glutamate efflux, which is barely affected by 10 nm VP (n = 5). B, dose–response relationships for the peak of taurine efflux versus VP concentration. Data were fitted with a logistic equation of the form 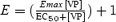 where E and Emax represent the peak of relative efflux and its maximum, and EC50 is the VP concentration that elicits 50% of Emax. The number of observations is indicated above data points. The dotted curve was fitted by excluding the 1 μm data point. C, efflux induced by 10 nm VP in 300 mosmol l−1 medium (continuous line; same data as control in A) or in 270 mosmol l−1 medium (dashed line; n = 5). >*P = 5 × 10⁻⁴. D, efflux induced by 500 nm (continuous line; n = 6) or 10 nm (dashed line; n = 3) OT.