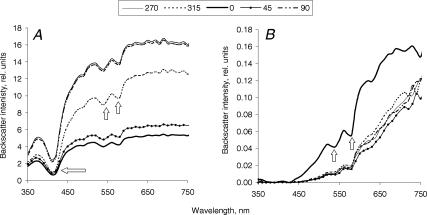
Figure 2. Spectra of backscattered light, acquired from the unloaded horse tendon (a representative sample) in a longitudinal set-up with 300 μm (A) and 2.75 mm (B) separation probes.
The probe was placed perpendicular to the tendon surface, so light propagated perpendicularly to the tendon longitudinal axis. The tendon sample was rotated to achieve different angles between the tendon longitudinal and the probe detection axes. At the 0 deg position, the detection axis of the probe was parallel to the tendon axis, and at the 90 and 270 deg positions it was perpendicular to it. Each line represents a mean (n = 3) of spectra acquired from the adjacent areas of the tendon at the same position of the probe. Arrows indicate characteristic haemoglobin absorption signatures.

