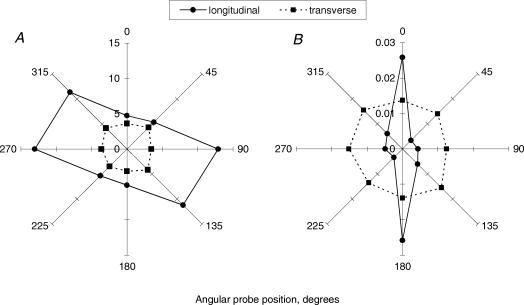
Figure 4. Radial diagrams of the intensity of backscattered light at 500 nm from unloaded tendons obtained in longitudinal and transverse measurement set-ups with 300 μm (A) and 2.75 mm (B) separation probes.
Each data-point represents a mean of n = 7 and n = 3 tendon samples for 300-μm and 2.75-mm probe separations, respectively.

