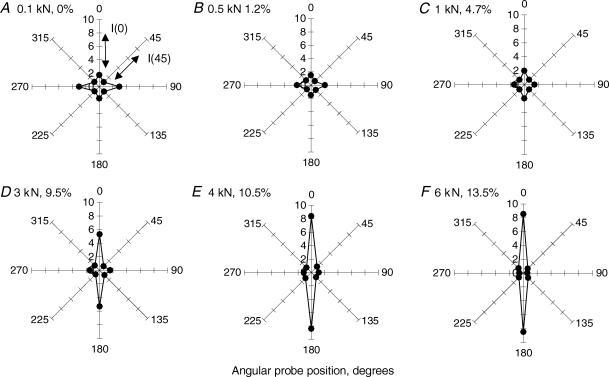
Figure 5. A series of radial diagrams of the intensity of backscattered light at 500 nm for a representative tendon subjected to the progressive uniaxial loading (load, strain).
A, 0.1 kN, 0%; B, 0.5 kN, 1.2% C, 1 kN, 4.7%; D, 3 kN, 9.5%; E, 4 kN, 10.5% F, 6 kN, 13.5%. Each data-point represents mean (n = 3) of backscatter intensities from the spectra taken from adjacent areas of the tendon at the same position of the probe. In each diagram light intensities at different angular positions were normalized to the respective light intensity at 45 deg, so direct comparison between different loads could be made. Anisotropy factor, AFII(500 nm), was calculated as a ratio between backscatter intensities at 0° and 45° positions of the probe.

