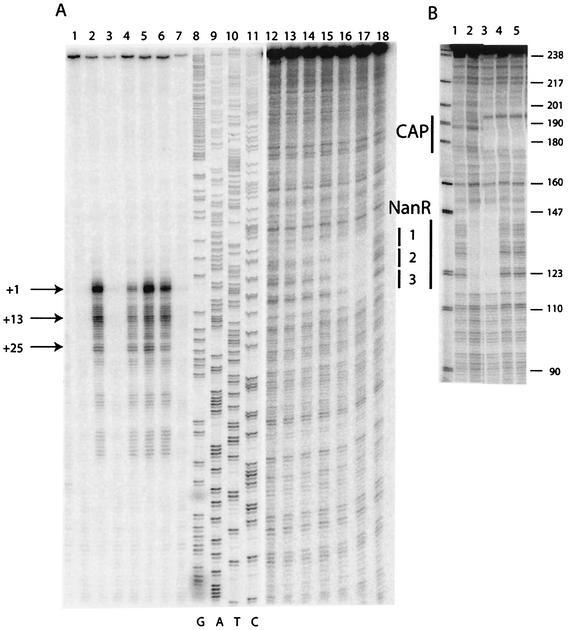
FIG. 2.
S1 nuclease transcript mapping and DNA footprint analysis of the nanR-nanA intergenic region. (A) The DNA fragment used for the analyses was the 439-bp PCR Nan1-2 (Fig. 3) labeled at the Nan1 end within the nanA ORF. Lanes 1 to 7, S1 mapping of nanA transcripts (25 μg of total RNA) isolated from JM101 (lanes 1, 3, and 5) and IBPC1016 (nanR6) (lanes 2, 4, and 6) grown on glycerol (lanes 1 and 2), glucose (lanes 3 and 4), and Neu5Ac (lanes 5 and 6). Lane 7, control (25 μg of tRNA). Lanes 8 to 11, DNA sequencing reactions on the Nan1-2 fragment using the Nan1 oligonucleotide as a primer. Lanes 12 to 18, DNase I footprinting on the Nan1-2 fragment (lanes 12 to 17 show the binding of purified NanR-His6 at 0.9, 1.7, 3.5, 7.0, 14, and 41 nM; lane 18 shows the free DNA). (B) The DNA fragment used for DNase I footprinting was the 245-bp Nan1-BstN1 fragment labeled at the Nan1 end. Lane 1, free DNA; lane 2, DNA with crude extract of NanR-overproducing strain (∼50 μg of total protein/ml); lane 3, same as lane 2 with 20 nM CAP and 200 μM cyclic AMP (cAMP); lane 4, 5 nM CAP and 200 μM cAMP; lane 5, 20 nM CAP and 200 μM cAMP. The numbers on the right are sizes (in base pairs) of pBR322 after digestion (shown at left) with MspI.

