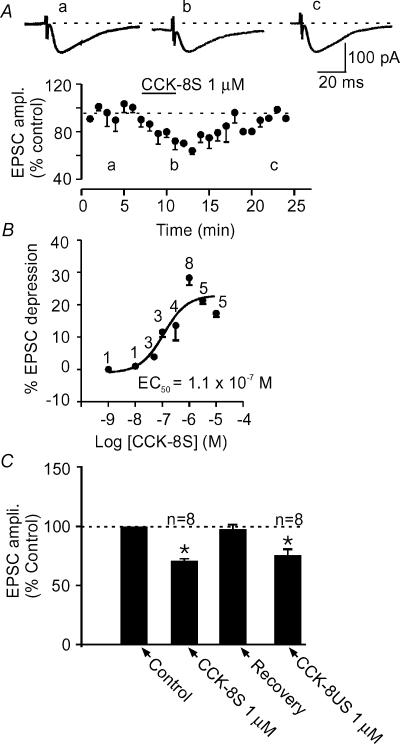
Figure 2. CCK inhibits evoked EPSCs in the NAc.
A, bath application of CCK-8S, the endogenously active analogue of CCK, caused a reversible depression of evoked EPSC amplitude. An average time–effect plot generated from eight cells that received 1 μm of CCK-8S for the duration indicated by the length of the line. Upper panel shows representative EPSC traces taken from the times indicated by letters in the time–effect plot. B, dose–response curve of CCK's effect on evoked EPSC amplitude obtained by applying different concentrations of CCK-8S. The calculated EC50 is 0.11 μm. The number above each point indicates the number of cells that received the corresponding concentration. C, a bar graph summarizing the effect of CCK-8S on evoked EPSC in comparison with CCK-8US. In this and in all other figures, asterisks indicate a significant difference compared to control at P < 0.05.

