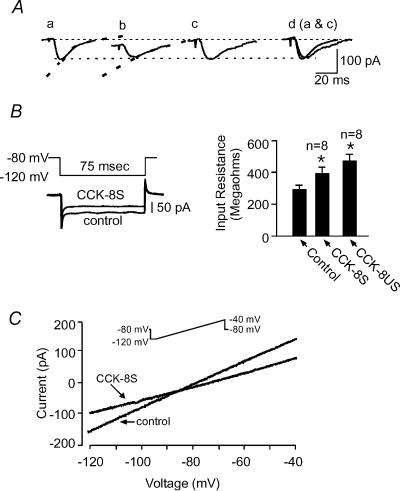
Figure 3. CCK-8S causes postsynaptic changes in NAc cells.
A, bath application of both CCK-8S and CCK-8US in most cells recorded in this region induced an inward current. Sample EPSCs recorded in control (a) and in the presence of 1 μm CCK-8S (b). Note the inward shift in the holding current in trace b. Dashed line on each trace is the exponential fit to the decay of the response. Trace c is trace b scaled to the amplitude of trace a, and d shows the scaled trace b superimposed on trace a. B, left panel: instantaneous steady-state current responses to 20 mV negative voltage steps (above) from the holding potential to measure input resistance (Rinput). Note that the inward current induced by CCK-8S was offset to superimpose this trace on the control trace. B, right panel: a bar graph summarizing the changes in Rinput induced by CCK-8S and CCK-8US, calculated from the traces on the left. C, steady-state current–voltage (I–V) relationships obtained from the same cell as in A in control and at the peak of the CCK-8S-induced synaptic depression. Inset shows the ramp protocol used to generate these curves.

