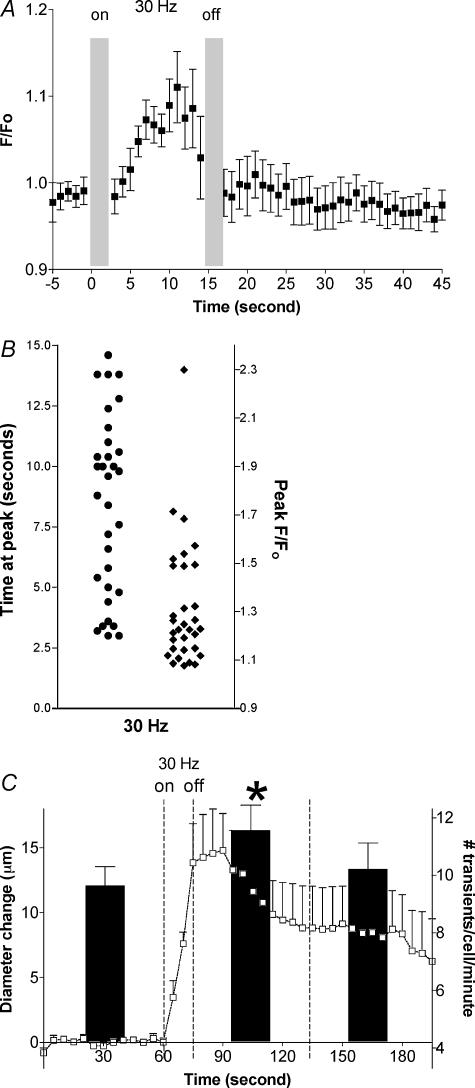
Figure 3. Changes in endothelial cell Ca2+ and diameter in response to muscle contraction.
A, averaged time course of the change in whole cell Ca2+ during and after muscle contraction. EC Ca2+ response is expressed as relative change in the fluorescence emission intensity from normalized baseline (F/F0). Muscle contraction was from time = 0 s to time = 15 s: the grey bars indicate periods during which EC Ca2+ data were not obtainable due to tissue movement. (n= 32 ECs). B, scatter plots of time to peak fluorescence during the 30 Hz stimulation (•, left side) and peak fluorescence ratio (♦; right side) for the averaged data shown in A. Peak fluorescence in all ECs was always attained during the stimulation period. C, mean changes in localized EC Ca2+ transients (black bars, right y-axis, n= 62) during the 1 min period before and each of the 2 min periods after muscle contraction, shown in relation to the averaged time course of the diameter changes in the same preparations (□, left y-axis, n= 5). *Significantly different from frequency of localized transients before muscle contraction or in second minute post contraction (P < 0.05). Values are means ±s.e.m.

