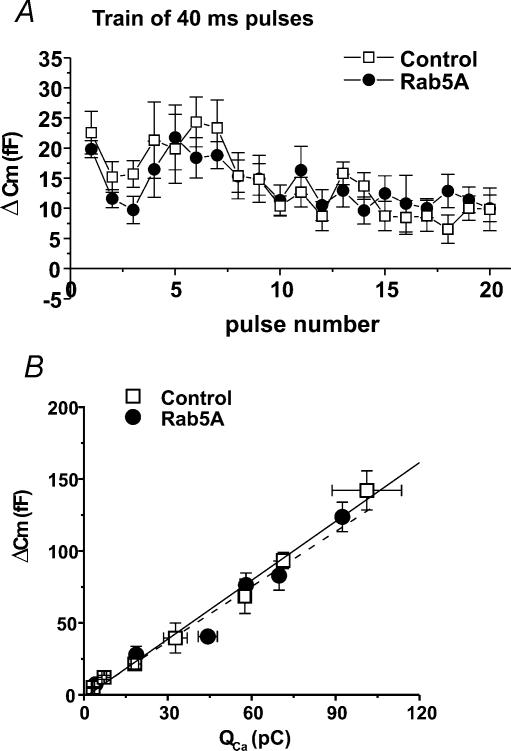
Figure 5. Adenoviral-induced expression of EGFP-tagged Rab5A in bovine adrenal chromaffin cells has no effect on exocytosis during a train of depolarizations, and no effect on the calcium influx–exocytosis relationship.
A, average Cm response (ΔCm) in control and Rab5A-expressing cells for each pulse of a train of 40 ms depolarizations (−90 mV to +20 mV, 200 ms between pulses). n= 8 and 9 cells for control and Rab5A, respectively. B, average ΔCmversus calcium influx for 10, 40, 160 and 320 ms depolarizations (n= 8 cells for control and 10 cells for Rab5A). See Fig. 3 legend for details on generation of calcium influx-vesicle fusion relationship. (N for bins ranges between 3 and 5 for control and 4 and 10 for Rab5A.) Lines are linear regression fits to the data (control, continuous line; slope = 1.4 fF pC−1, y-intercept =−2.1 fF, R= 0.995; Rab5A, slope = 1.3 fF pC−1, y-intercept =−1.2 fF, R= 0.98). [Ca2+]o= 5 mmol l−1. Error bars are ±s.e.m.

