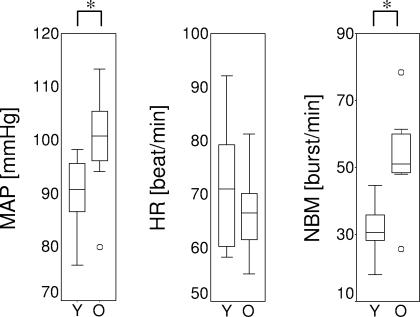
Figure 2. Baseline values.
Baseline MAP (mean arterial pressure measured with sphygmomanometer), HR (heart rate) MSNA in burst frequency (NBM) per group (Y, Young; O, Old). Boxplots show median, range and interquartile range. ° Indication of excluding outliers; * indication of a significant difference between groups with Mann-Whitney U tests.

