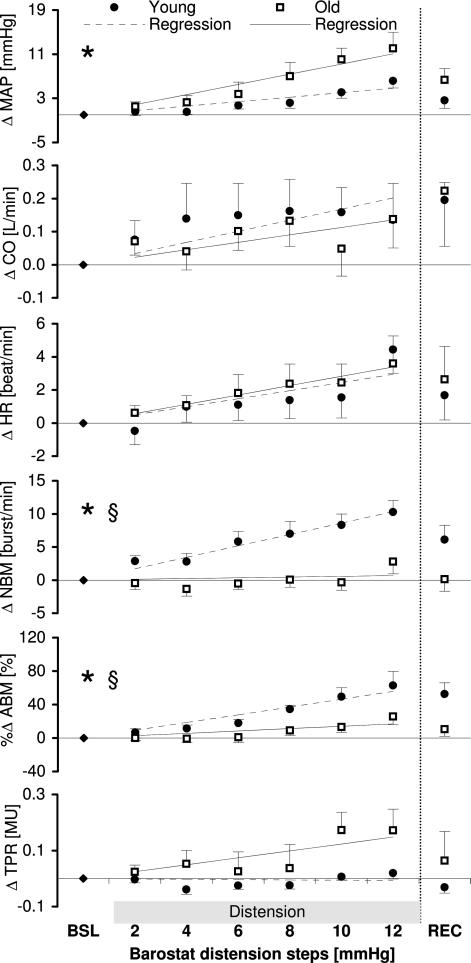
Figure 3. Course of parameters (Δ) during barostat gastric distension.
Changes in MAP (mean arterial pressure), HR (heart rate) and MSNA in NBM (burst frequency) and ABM (total area under the curve per minute) in reaction to stepwise stomach distension. * Indication of significant changes in time as calculated with repeated measures anova; § indication of a significant difference between the groups or a significant interaction. For details, see text.

