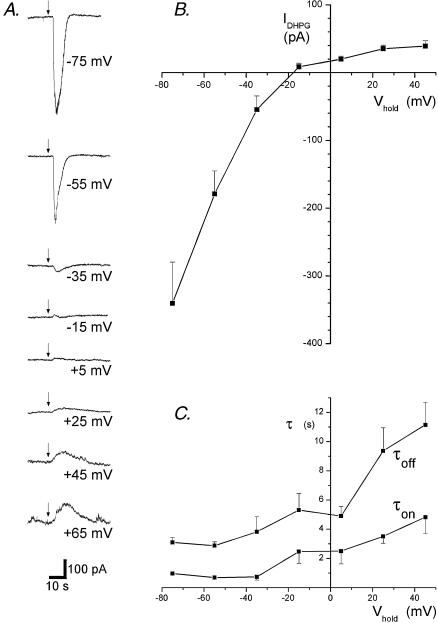
Figure 2. The I–V of mGluR1 selective responses to DHPG.
A, traces show the current responses to pressure ejection of DHPG (100 μm, 1 s, arrows) at the holding potentials indicated. No averaging was performed. B, the histogram shows the I–V generated from measurements of the peak amplitude of the current evoked by DHPG at each holding potential in 7 cells. C, this graph shows the time constants estimated by single exponential fits of the EPSC waveform during the increase (τon) and decrease (τoff) of the current amplitude at each potential for the same cells shown in B.

