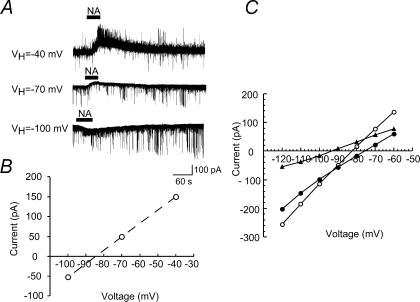
Figure 6. Voltage dependency of NA-induced current.
A, NA (50 μm)-induced currents recorded at different VH (−40, −70, −100 mV); these were obtained from the same neurone. B, amplitude of the membrane currents shown in A was plotted against VH. C, amplitude of membrane currents in response to voltage pulses having a duration of 200 ms from VH=−70 mV was plotted against voltages in the absence (filled circles) and presence (open circles) of NA (50 μm). The current–voltage relationship for net NA current was estimated from the difference between the current responses in the absence and presence of NA (filled triangles).

