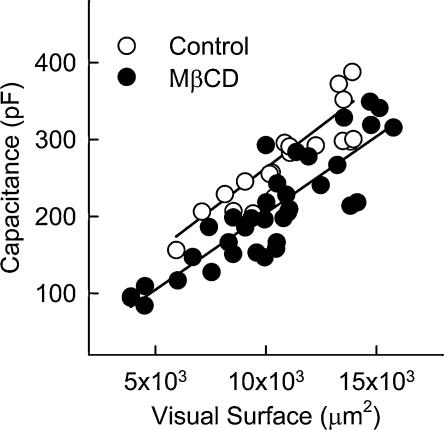
Figure 3. For a constant visual surface, cell membrane capacitance is reduced in MβCD-treated cells.
Cell membrane capacitance is plotted as a function of the visual surface for 21 control cells and 36 MβCD-treated cells. The continuous lines correspond to a linear fit to the values of each population of cells.

