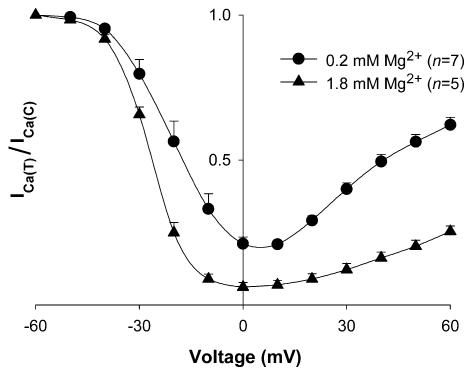
Figure 3. Effect of [Mg2+]p on inactivation curves for ICa.
The Vm dependence of channel inactivation was measured at 5 min after break-through into the whole-cell patch-clamp configuration with a 2-pulse protocol. ICa at 0 mV after a given prepulse (ICa(T)) is divided by ICa at 0 mV after a prepulse to –60 mV (ICa(C)). Data are means and s.e.m., with the number of experiments indicated in parentheses for each [Mg2+]p.

