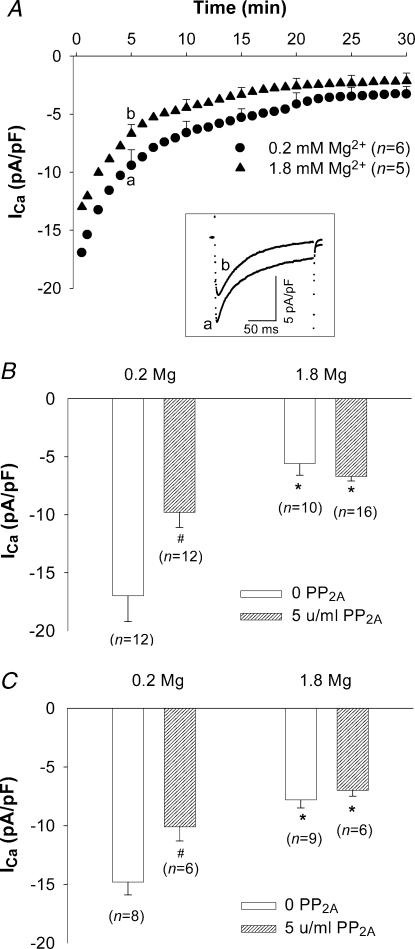
Figure 5. Effect of [Mg2+]p on ICa in low phosphorylation conditions.
A, time diaries of ICa in rat ventricular myocytes depolarized to 0 mV from a holding potential of –40 mV during dialysis with 0.2 mm and 1.8 mm[Mg2+]p electrode solution containing 5 units ml−1 PP2A. Data are means with sample s.e.m. displayed for 5, 10, 15, 20, 25 and 30 min time points. The numbers of experiments are indicated in parentheses. Letters (a and b) in each time course correspond to the sample currents in the inset. Inset: superimposed currents recorded 5 min after patch break-through. B, ICa density in myocytes dialysed with 0.2 mm and 1.8 mm[Mg2+]p in control (0 PP2A) and low phosphorylation conditions (5 units ml−1 PP2A) in the presence of 100 nm[Ca2+]p. C, ICa density in the rat ventricular myocytes dialysed with 0.2 mm and 1.8 mm[Mg2+]p in control (0 PP2A) and low phosphorylation conditions (5 units ml−1 PP2A) in the presence of ∼1 nm[Ca2+]p. Currents were measured 5 min after break-through into the whole-cell patch-clamp configuration. Data are means and s.e.m., with the number of experiments indicated in parentheses. Significant changes of ICa, comparing low (0.2 mm) versus high [Mg2+]p (1.8 mm) and basal (0 PP2A) versus low phosphorylation conditions are indicated as * and #, respectively.

