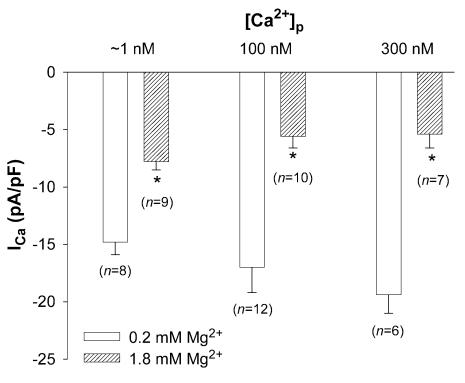
Figure 6. Effect of [Mg2+]p on ICa with different [Ca2+]p.
Currents were measured at a test potential of 0 mV in myocytes dialysed with 0.2 mm and 1.8 mm[Mg2+]p at ∼1 nm, 100 nm and 300 nm[Ca2+]p. Data are means and s.e.m., with the number of experiments indicated in parentheses. Asterisks (*) indicate significant changes of ICa between low (0.2 mm) and high [Mg2+]p (1.8 mm).

