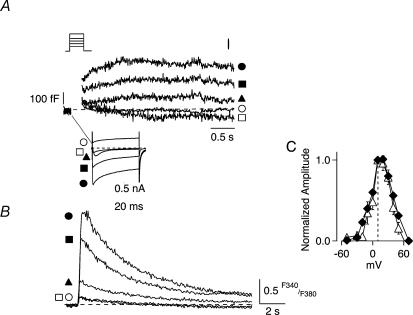
Figure 2. Voltage dependence of ΔCm parallels that for depolarization-evoked Ca2+ influx.
A, the relationships for ICa and ΔCm as a function of membrane potential were determined, as shown for a representative SON neurone, by delivering a series of 200 ms depolarizing steps to different test potentials in 10 mV increments from Vh=−90 mV. For purposes of clarity, only selected current (lower panel) and Cm traces (upper panel) from several test potentials are shown (□, −50; ▴, −30; ○, +10; ▪, +30; and ○, +70 mV). The amplitude of ICa (lower traces) increased in a voltage-dependent manner with increasing membrane depolarization up to a maximum obtained at +10 mV. A similar voltage-dependent profile was obtained for the corresponding increase in ΔCm (upper traces) measured at the termination of each depolarizing step. B, the increases in ICa and ΔCm recorded at a given test potential were accompanied by corresponding elevations in intracellular Ca2+ concentration ([Ca2+]i), as measured fluorometrically by inclusion of the Ca2+-sensitive dye fura-2 in the recording pipette. Note that stepping to test potentials that evoked either negligible or outward ICa (−50 and +70 mV, respectively), resulted in little change in [Ca2+]i and did not evoke ΔCm responses. C, direct comparison of the complete voltage-dependent relationship for the normalized amplitude of the depolarization-evoked ΔCm (Δ) and for the corresponding Ca2+ charge integral, QCa as a function of test potential (⋄) revealed that they were tightly correlated.

