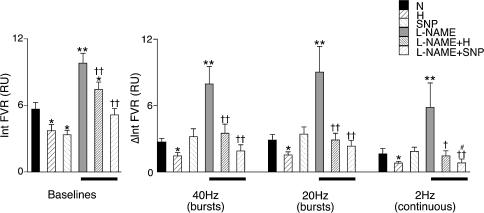
Figure 2. Effect of hypoxia, SNP and l-NAME on vasoconstrictor responses evoked in hindlimb muscle by different patterns of sympathetic stimulation in N rats.
Panel on left shows baseline values from which responses to sympathetic stimulation were evoked, as the integral of FVR (Int FVR) over 1 min. Panel to the right shows the evoked responses to the three patterns of stimulation as indicated below panel; responses are shown as change in the integral of FVR from baseline (ΔInt FVR) over 1 min (columns show mean ±s.e.m.). Conditions under which baselines and responses were recorded are shown by the different shading (see key): N, breathing 21% O2; H, breathing 8% O2; SNP, during SNP infusion; l-NAME, following l-NAME; l-NAME + H, breathing 8% O2 after l-NAME; l-NAME + SNP, SNP infusion after l-NAME administration. Bars below panel indicate responses after l-NAME. *Significant difference from values recorded in N. †Significant difference from values recorded after l-NAME administration. #Significant difference from value recorded during SNP infusion before l-NAME. In each case 1 and 2 symbols indicate P < 0.05 and P < 0.01, respectively.

