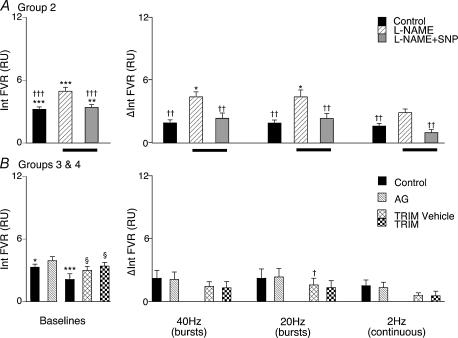
Figure 3. Effect of NOS inhibition on vasoconstrictor responses evoked in hindlimb muscle by different patterns of sympathetic stimulation in CH rats.
Panels on left in A and B show baseline values for the integral of FVR recorded under the different experimental conditions and panels on right show changes from baseline of the integral of FVR evoked by the three patterns of sympathetic nerve stimulation, as described for Fig. 2. Conditions are indicated by the key. Control, breathing 12% O2. Abbreviations in A: l-NAME, following l-NAME; l-NAME + SNP, during SNP infusion to restore baseline (Group 2). Abbreviations in B: AG, following administration of aminoguanidine (Group 3); TRIM vehicle, following administration of vehicle for TRIM (Group 4); TRIM, following administration of TRIM in vehicle (Group 4). *Significant difference from values recorded in N rats. †Significant difference from values recorded after antagonist administration. §Significant difference from own control. In each case 1, 2 and 3 symbols indicate P < 0.05, P < 0.01 and P < 0.001, respectively.

