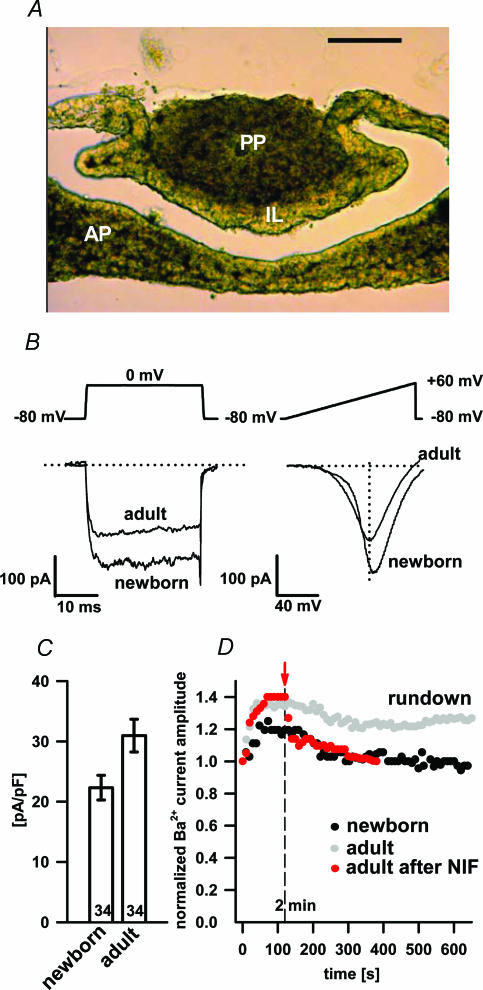
Figure 1. Newborn (P1) pituitary tissue slice (A), the separation of VACCs by pulse depolarization and voltage ramps (B), HVA peak Ba2+ current density (C) and washout of Ba2+ currents (D).
A, the newborn (P1) pituitary tissue slice (scale bar 100 μm; transmission photomicrography). The intermediate lobe (IL) is clearly distinguishable from the anterior (AP) and posterior part (PP) as a narrow band consisting of melanotrophs. B, representative traces of whole-cell Ba2+ currents evoked by 30 ms depolarization steps from −80 mV to 0 mV (left) and 300 ms voltage ramps from −80 mV to + 60 mV (right) in control conditions. Note that the peak amplitude of 30 ms depolarization traces corresponds to the peak amplitude of the HVA component obtained by the 300 ms voltage ramp. C, histogram of HVA peak Ba2+ current densities in adult and newborn melanotrophs. Numbers on bars represent the number of cells tested. D, the washout of Ba2+ currents in adult (open symbols) and newborn (filled symbols) melanotrophs during 10 min of dialysis and time dependence of nifedipine block (10 μm) of L-type Ba2+ currents in adult melanotrophs (red symbols). Nifedipine was applied 2 min after the whole-cell dialysis (see red bar).

