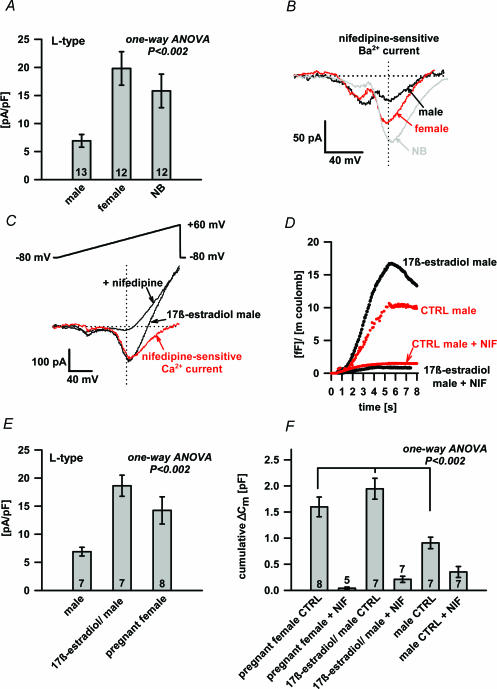
Figure 6. The oestrogen effect on the L-type Ca2+ current and Cm changes.
A, the difference in nifedipine-sensitive Ba2+ current density between adult male, adult female and newborn (NB) melanotrophs. HVA peak Ba2+ current amplitudes were statistically different (P < 0.002; one-way ANOVA). Numbers on bars represent the number of cells tested. B, typical nifedipine-sensitive Ba2+ current recordings from the adult male (black trace), adult female (red trace) and newborn (NB) melanotroph (grey trace). Note the comparable LVA component and the different HVA current between adult male, adult female and newborn (NB) melanotrophs. C, the representative Ca2+ current recording from male melanotrophs incubated 24 h in 1 nm 17β-oestradiol before (arrow) and after nifedipine treatment (arrow). A major part of the Ca2+ current amplitude was nifedipine sensitive (red trace). D, the representative normalized cumulative membrane capacitance responses to the train of depolarizing pulses from male melanotrophs incubated 24 h in 17β-oestradiol before and after the nifedipine treatment (black traces). Secretory responses of control male melanotrophs only incubated in phenol red-free medium before and after the nifedipine treatment (red traces). Note that cumulative Cm was normalized to the Ca2+ influx. E, the difference in the nifedipine-sensitive Ca2+ current density between male melanotrophs in control conditions, 17β-oestradiol-treated male pituitary slices and pregnant female (day 19). HVA peak Ca2+ current amplitudes in males were statistically different (P < 0.002; one-way ANOVA). Numbers on bars show the number of cells tested. F, the comparison of Cm response in pregnant female, 17β-oestradiol treated male pituitary slices and male melanotrophs in control conditions. Cm responses were statistically different (P < 0.002; one-way ANOVA). Numbers on bars show the number of cells tested.

