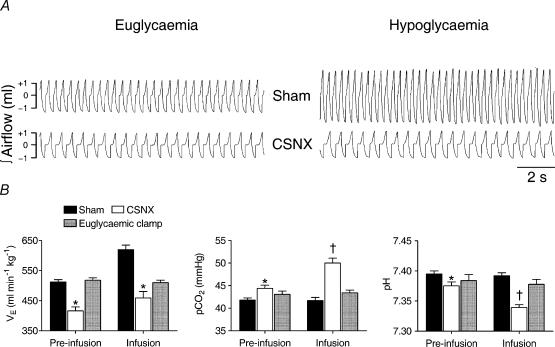
Figure 2. Effect of hypoglycaemia on spontaneous ventilation (V̇E), Pa,CO2 and pH.
A, representative traces of integrated tracheal airflow from a sham (above) and a CSNX (below) animal, taken 20min before insulin infusion (left) and at 60min after the infusion began (right). Inspiratory and expiratory flows were separately integrated and depicted in a single trace with + indicating inspiratory volume and – indicating expiratory volume. B, means ±s.e.m. of V̇E, Pa,CO2 and pH in sham (n= 7), CSNX (n = 7) and euglycaemic clamped animals (n = 7) before (10–40min prior) and during (20–90min post) insulin infusion at 0.4Umin−1kg−1. * and † indicate significant difference (P < 0.05) from sham and CSNX preinfusion levels, respectively.

