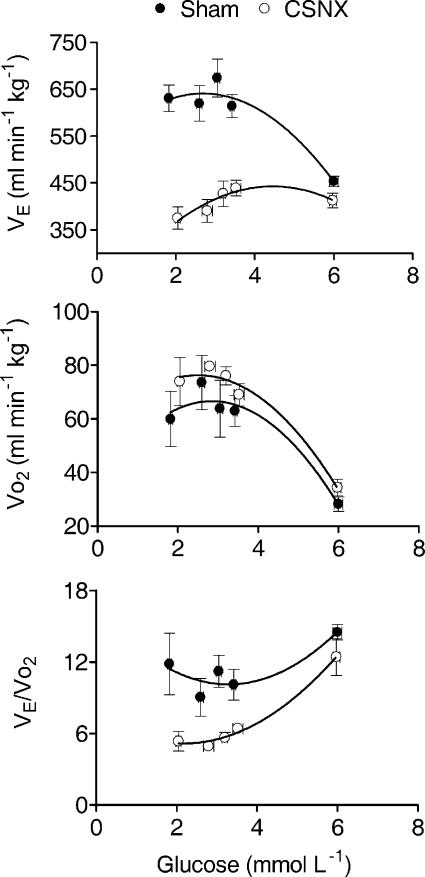
Figure 3. Changes in minute ventilation (V̇E), oxygen consumption (V̇O2) and ventilatory equivalent (V̇E/V̇O2) at varying blood glucose concentrations.
Data points represent means ±s.e.m. in sham (n = 4) and CSNX (n = 4) animals. Glucose concentrations were measured at fixed times during the protocol period. During insulin-induced hypoglycaemia (blood glucose < 4 mmoll−1), V̇O2 increased significantly in sham and CSNX groups (P < 0.02, ANOVA) whilst V̇E increased only in sham (P < 0.002, ANOVA). V̇E/V̇O2 therefore decreased only in CSNX (P < 0.001, ANOVA) and remained unchanged in sham. Data are shown fitted by second order polynomials.

