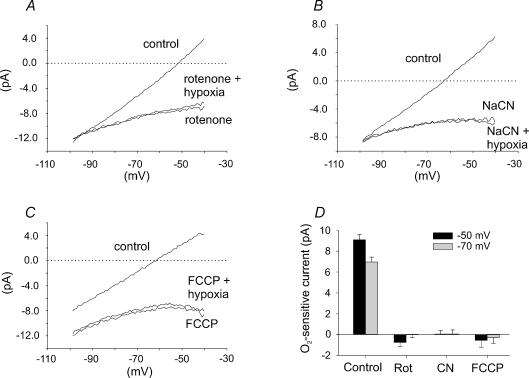
Figure 9. Effect of hypoxia, in combination with application of rotenone, NaCN and FCCP, on membrane currents in type I cells.
A, mean I–V relationships (n= 6) in control conditions, in the presence of 1μm rotenone and in the presence of 1μm rotenone and hypoxia (6 Torr). B, mean I–V relationships (n= 6) in control conditions, in the presence of 2 mm NaCN and in the presence of 2 mm NaCN and hypoxia (6 Torr). C, mean I–V relationships (n= 4) in the presence of 1μm FCCP and in the presence of 1μm FCCP and hypoxia (6 Torr). Note the absence of any additional effect of hypoxia upon membrane currents in the presence of rotenone, cyanide or FCCP. D, comparison of mean (+s.e.m.) oxygen-sensitive current measured at two different potentials −50 mV (black bars) and −70 mV (grey bars) under control conditions (control – hypoxia; n= 46) with that determined in the presence of rotenone (rotenone – hypoxia and rotenone; n= 6), cyanide (cyanide – hypoxia and cyanide; n= 6) and FCCP (FCCP – hypoxia and FCCP; n= 4). Note that the magnitude of the oxygen-sensitive current measured in the presence of mitochondrial inhibitors was negligible compared to that determined under control conditions.

