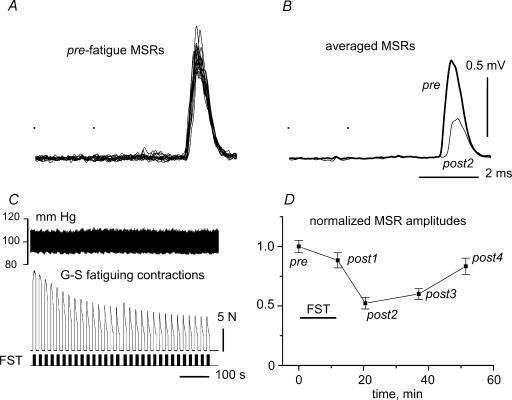
Figure 1. Changes in monosynaptic reflexes of gastrocnemius–soleus motoneurones (G–S MSRs)after fatiguing G–S stimulation.
A, superposition of 12 individual MSRs recorded in prefatigue (pre) test. MSRs were evoked by two electrical stimuli to the G–S nerve (dots) with current strength 1.4 times the threshold value. B, averages of the pre (thick) and post2 (thin line) MSRs. C, fatiguing stimulation (FST), with stimulus marks sketched in the bottom trace, isometric muscle force in the middle trace and blood pressure at the top. D, change of MSR amplitude over time. The means ± s.e.m. of 12 MSRs within each test period were determined, normalized to the mean prefatigue amplitude and plotted as a function of time. The period of FST is indicated by a horizontal bar.

