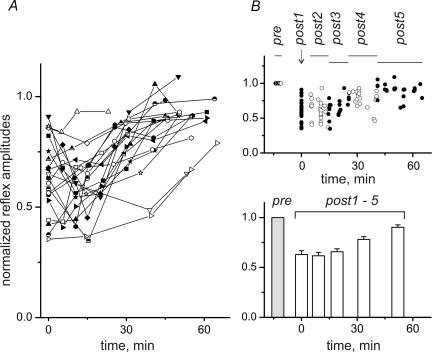
Figure 2. Postfatigue changes of MSRs.
A, 21 fatigue tests were run in 16 different experiments; in 5 experiments the test procedure was repeated in the opposite hindlimb. For comparison of data from different experiments, all curves, such as the one in Fig. 1D, were plotted on a time axis whose zero point (t = 0) was set at the midpoint of the post1 period. B, for statistical analysis, all data points from different trials across different experiments were sorted into six contiguous time slots, so that each contained approximately the same number of data points. As illustrated in the upper plot, this process yielded time slots of different durations, as indicated by the horizontal lines labelled pre and post1–post5. For easier distinction, the data points falling into adjacent slots are shown as open and filled circles. The consecutive slots covered the following time intervals: post2, 5.0–14.4 min; post3, 14.5–25.6 min; post4, 25.7–40.6 min; post5, 41.1–65.2 min. The means ±s.e.m. determined for the data in every slot are shown in the bottom graph, with the prefatigue control shown as a grey column. Statistical significance of the differences of MSRs belonging to different time intervals (repeated-measures ANOVA with post hoc Bonferroni adjustment for multiple comparisons) is shown in Table 1.

