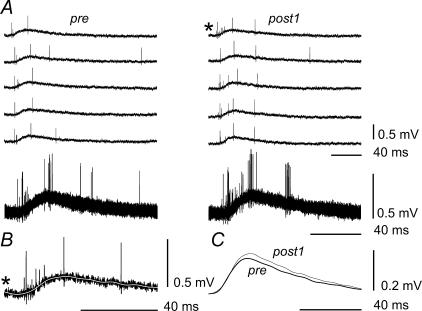
Figure 4. Analysis of the dorsal root potential (DRP) changes during fatigue.
A, five examples of 12 single DRPs (five upper traces), recorded in pre and post1 tests (left and right columns, respectively), and superposition of upper traces in the bottom row. B, comparison of individual original (black trace) and off-line-filtered (white trace) records of a DRP. The individual DRP record marked by an asterisk in the first row of the right column in A is reproduced by the black line with the asterisk in B. This record was then subjected to off-line digital filtering using a fast Fourier transformation (FFT) procedure with a 0.01 Hz cut-off frequency in order to eliminate the spikes. This procedure yielded the superimposed white line, with the spikes extinguished. C, superimposed averages of the 12 individual filtered DRPs from each period (pre and post1).

