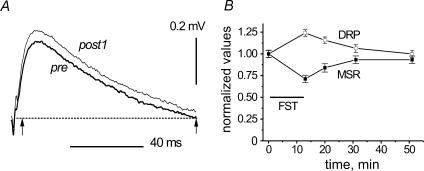
Figure 5. Fatigue-dependent changes of slow components in DRPs.
Quantitative analysis of postfatigue DRP changes. The same procedures of smoothing and averaging as in Fig. 4 were applied to DRPs recorded in another experiment. A, superimposed examples of the averaged records (pre and post1 tests), the dotted line indicating zero potential. B, for further quantitative analysis, the individual filtered DRP records in all five test periods were integrated over the time interval indicated by the arrows in Fig. 5A. The time interval chosen for integration approximately coincided with the duration of the averaged prefatigue wave; initial fast transients that could fluctuate more intensely were excluded from analysis. The means ±s.e.m.(n = 12) of the integrals were determined for each test period, normalized to the mean value of the pre test and plotted as a function of time (□), together with the normalized MSR amplitudes (▪).

