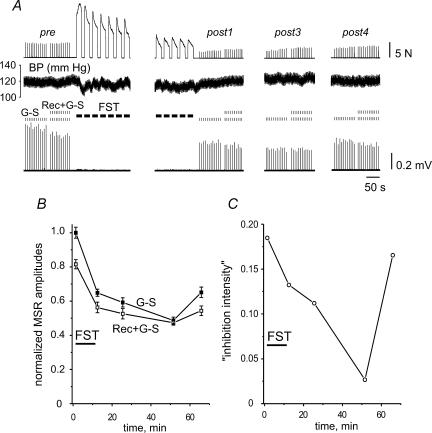
Figure 6. Fatigue-dependent changes in the intensity of recurrent inhibition.
A, muscle force (upper trace), blood pressure (BP; second trace), stimulus marks and evoked MSRs (lower two traces; G–S, unconditioned MSRs; Rec + G–S, recurrently conditioned MSRs). The precise timing of the test periods can be derived from the graph in B. Duration of FST was 10 min. B, amplitudes of the unconditioned (G–S) and conditioned (Rec + G–S) MSRs in different test periods, normalized to the mean unconditioned prefatigue MSR amplitude. C, ‘Inhibition intensity index’, as defined for presynaptic inhibition (see text), plotted versus time.

