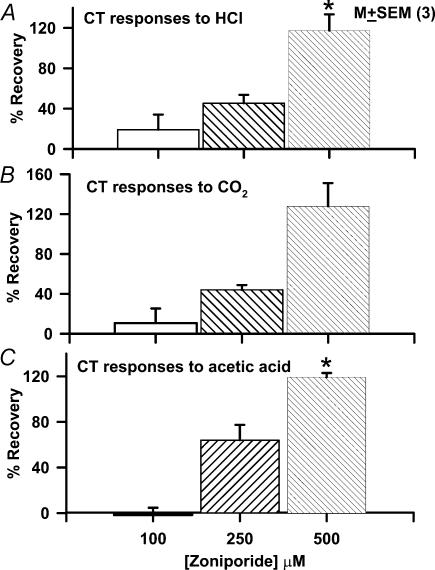
Figure 8. Effect of varying zoniporide concentration on the ionomycin-induced changes in CT responses to acid stimulation.
The CT responses to acidic stimuli were recorded under control conditions (Control), after the topical lingual application of 150μm ionomycin (Ionomycin), and following topical lingual application of zoniporide (100, 250, and 500μm) + 150μm ionomycin (Zoniporide). All rinse (R) and test solutions (S) contained, in addition, 10mm CaCl2. The percentage recovery of the tonic part of the normalized CT response to 20mm HCl (A), CO2 (B), and 10mm acetic acid (C) was calculated at each zoniporide concentration for each individual animal (see text for details). The percentage recovery was expressed as the mean ± s.e.m. of 3 animals (N) at each zoniporide concentration. *P<0.01 (paired).

