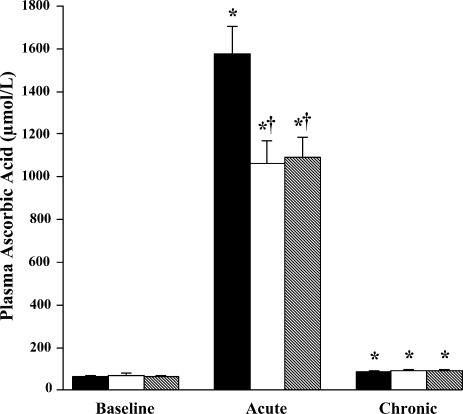
Figure 1. Plasma ascorbic acid concentrations.
Plasma ascorbic acid concentrations are shown at baseline, after acute ascorbic acid infusion, and after 30 days of ascorbic acid supplementation. Filled bars: young sedentary; open bars: older sedentary; and hatched bars: older endurance trained. Acute = post-infusion; Chronic = end of oral supplementation. * P < 0.0001 versus baseline within the same group; † P < 0.01 versus young within the same condition.

