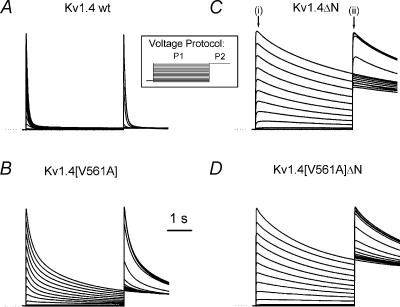
Figure 2. Representative current traces in response to a two-pulse steady state inactivation protocol.
Channels were expressed in Xenopus oocytes and recorded with the two electrode voltage clamp technique. The initial 4 s pulse, P1, was to a voltage between –100 and +50 mV, in 10 mV steps. This was followed immediately by a 2 s pulse, P2, to +50 mV. The voltage protocol is shown in the inset. Currents are from: Kv1.4 wt (A); Kv1.4[V561A] (B); Kv1.4ΔN (C); and Kv1.4[V561A]ΔN (D). Currents are scaled so that the peak P1 current at +50 mV from each channel is the same size to allow comparisons. Dotted lines indicate zero current. The N-terminal-deleted currents exhibit the much slower C-type inactivation, whereas the inactivation of currents from N-terminal-intact channels are dominated by the much faster N-type inactivation. In C, (i) and (ii) indicate where the current–voltage and steady-state inactivation data were measured.

