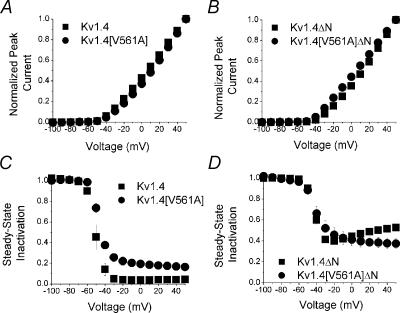
Figure 4. Current–voltage and steady-state inactivation relationships.
Peak current elicited by the P1 pulse from the two pulse protocol (see Fig. 2C(i)) is plotted against voltage for A: Kv1.4 (▪) and Kv1.4[V561A] (•) and B: Kv1.4ΔN (▪) and Kv1.4[V561A]ΔN channels (•; n= 5, error bars are smaller than symbols). Steady-state inactivation relationships were determined from the two pulse protocol by calculating the ratio of the peak current in the P2 pulse (Fig. 2C(ii)) to the maximum value of the peak P1 current (Fig. 2C(i)). Steady-state inactivation relationships are shown for C: Kv1.4 (▪) and Kv1.4[V561A] (•) and D: Kv1.4ΔN (▪) and Kv1.4[V561A]ΔN channels (•; n = 5).

