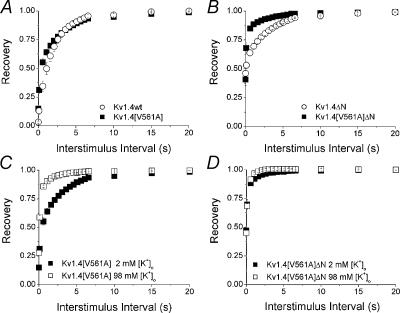
Figure 6. Recovery from Inactivation.
Recovery from inactivation was measured using a standard variable interval gapped pulse protocol. An initial 5 s pulse (P1) from –90 to +50 mV was followed by a second pulse (P2) after an interval of between 0.1 and 20 s. The ratio of the peak current elicited by the P1 and P2 pulses (Ipeak,P2/Ipeak,P1)is plotted against pulse interval to show the recovery from inactivation. A, recovery curves for Kv1.4 (γ) and Kv1.4[V561A] (▪) in 2 mm[K+]o. B, recovery curves for Kv1.4ΔN (γ) and Kv1.4[V561A]ΔN (▪) in 2 mm[K+]o. Relationship between [K+]o and recovery from inactivation of the mutant channels was measured using the same protocol. C, recovery from inactivation of Kv1.4[V561A] in 2 (▪) and 98 mm [K+]o (□). D, recovery from inactivation of Kv1.4[V561A]ΔN in 2 (▪) and 98 mm [K+]o (□).

