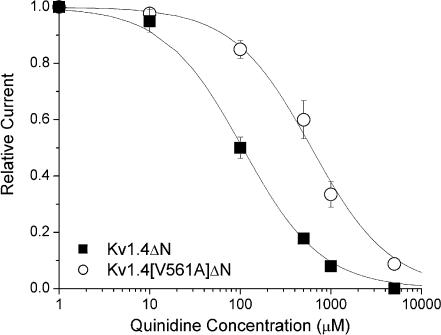
Figure 8. Dose–response curve for quinidine.
The binding of quinidine to Kv1.4 ΔN (▪) and Kv1.4[V561A]ΔN (○) in 2 mm[K+]o. Continuous lines are from a fit of the relationship f=KD/(KD+[D]), where f is fractional current, KD is the apparent dissociation constant, and [D] is the quinidine concentration. Using this relationship, Kv1.4ΔN current was reduced to 50% by 106 mm quinidine, but 611 mm quinidine was required to reduce Kv1.4[V561A]ΔN by 50%.

