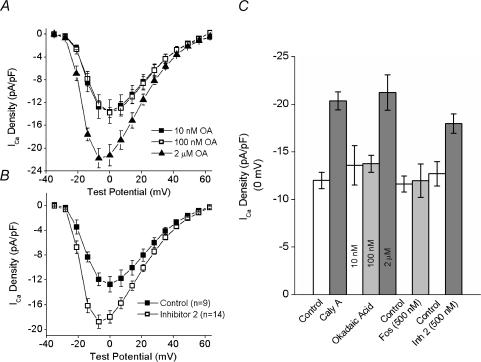
Figure 7. Effects of intracellular okadaic acid and inhibitor–2 on the ICa–V relationship.
A, mean (± s.e.m.) ICa–V plots from cells dialysed with okadaic acid (OA) in concentrations of 10nm (▪ n= 5, 2), 100nm (□; n= 4, 2) and 2μm▴ n= 6, 2). B, average ICa–V plots from control cells (▪; n= 9, 4) and cells dialysed with 500nm inhibitor-2 (□; n= 11, 6). C, summary histogram of the effects of calyculin A, okadaic acid, fostriecin and inhibitor-2 at 0mV. The first two bars represent the average ICa before and after calyculin A from all of the experiments in which calyculin A was added in the absence of any inhibitors (n= 19, 8; data from Figs 3A, 4A and 6A and B).

